Behind Numbers

Unlock Your Numbers.
Maximize the power of information.

Behind Numbers helps businesses build statistical models, interactive dashboards and predictive analytics workflows - granting complete ownership of your raw data, operational spend, and data-driven business decisions.

Foundational Knowledge Areas

Data Driven Management
Statistics and Data Modelling
Business Intelligence
Marketing and Strategy
Accounting and Financial Management
Leadership

Language & Skills

R languageR
StataStata
SQLSQL
TableauTableau
HTMLHTML
CSSCSS
JavaScriptJS

Certificates

About

Hi there! I am Xueke (Polly), a UK-based Master's graduate in Management with Business Analytics, junior front-end developer, passionate about Data Science and Machine Learning. Welcome to my first personal website!

I graduated with Merit from Bournemouth University's Business School-an AACSB-accredited institution ranked among the top 6% globally.

Transitioning into tech without a traditional CS background, I've independently earned two AWS certifications while expanding into front-end development. During my master's studies, I devoted several months to developing this website. My strength lies at the intersection of technical execution, data analytics, and commercial strategy.

I firmly believe that passion and consistency make things happen!

AI Specialization

"Earners of this badge understand AI, ML, and generative AI concepts, methods, and strategies in general and on AWS. They can determine the correct types of AI/ML technologies to apply to specific use cases and know how to use AI, ML, and generative AI technologies responsibly. They are familiar with the AWS Global Infrastructure, core AWS services and use cases, AWS service pricing models, and the AWS shared responsibility model for security and compliance in the AWS Cloud."

Amazon Web Services
S3
ECR
BLEU
GANs
VAEs
RNNs
Amazon Web Services
Artificial Intelligence(AI)
Foundation Models
Generative AI
GPT
SageMaker
BERT
Transformer
ROUGE

Cloud Architecture

"Earners of this certification have a fundamental understanding of IT services and their uses in the AWS Cloud. They demonstrated cloud fluency and foundational AWS knowledge. Badge owners are able to identify essential AWS services necessary to set up AWS-focused projects."

Route53
EC2
EKS
AWS Cloud
Cloud Services
Elastic Beanstalk
Batch
EKS
Cloud Platform
Cloudfront
API gateway
Aurora
Amazon EFS
Amazon FSx
Amazon RDS
Cloud Computing
No SQL
Dynamo DB
Amazon Rekognition
Amazon Transcribe
Neptune

Industry Masterclasses & Awards

Why
Behind Numbers?

I built Behind Numbers on one core belief: businesses deserve secure, cost-effective, high-performance business analytics. By building and deploying scalable data pipelines, predictive dashboards, and statistical modelling tools across on-premise and cloud environments, I combine open-source data frameworks with in-depth analytical expertise. This delivers private, scalable, and tailored business analytics solutions that drive measurable business value, while ensuring full data governance, operational efficiency, and stakeholder trust.

What I have learnt matters most

Curiosity

Enjoying digging into messy data to find the "Why" behind the numbers.

Cross functional Collaboration.

Partnering closely with Tech, Product, Data team to understand pain points.

AI leveraging

Leveraging cutting-edge AI tools to automate repetitive workflows, speed up data pipelines, and accelerate analysis.

Continuous learning

Keep learning and grow with the fast-evolving world, staying the same is falling behind.

LOCATION LONDON, UK E1
CATEGORY MCC-5814 RETAIL-SHOP-LOG
STORE-BA07294121 | Retail | -£42.30
TICKET: #4091 | Sentiment: -0.72
POS_STORE: #104 EMEA | Target -14%
CHURN_RISK: High (Score 88)
STOCK_ALERT: SKU-402 (0 Left)
CONVERSION: 1.4% (Target 3.5%)
Modern businesses track millions
of operations every day,
but fully utilising the data
is hard.

I design well-structured ML and data pipelines.

Identify Business Goal

Frame ML problem

Collect Data

Pre-process Data

Engineer Features

Train, Tune, Evaluate

Deploy

Monitor


Projects

Does membership status correlate with higher single - transaction sales value?

This study aims to investigate if the membership status is correlated with higher single transaction sales value, utilising transactional records from a multi-regional supermarket enterprise sourced via Kaggle. The retail network spans three metropolitan markets: Chicago, Los Angeles and New York. Each supermarket comprises 2 branches: Branch A, Branch B.

This dataset has 1000 observations and 12 variables, capturing transaction identifiers, store attributes, customer profiles, product specifications, unit pricing, order quantities, tax liabilities, and cumulative monetary values.

Analytical Framework, Data wrangling, Statistical computing and Econometric modeling were executed in R, supplemented by Tableau for exploratory data visualization. To categorize the spending level, total spending was divided into three levels : low price: 1.21 ~ 38.38; middle price: 38.38 ~ 176.07; high price:176.07 ~ 433.99(unit: dollar). Quantile-based discretization was adopted. Each segment accounts for 25%, 50%, and 25% respectively. In this dataset, the mean (118.58) is significantly higher than the median (89.70), with a maximum value reaching 433.99. This indicates that this dataset is a Right-Skewed dataset, and a few extremely high-value purchases skew the mean upward. Under this distribution, quantiles were adopted to enhance estimation robustness.

Methodology and Key Findings

Ordinal Logistic Regression and Lasso Regression were adopted to assess the correlation between the membership status and high single transaction sales value.

The parametric estimates reveal no statistically significant association between membership status and transaction price bands (p > 0.05). However, customers in Los Angeles are less likely to fall into higher total-price groups compared with customers in Chicago; Stationery purchases are less likely to result in higher-value transaction tiers relative to beverages.

General Insights1

General Insights2

Analysis

●Demographic:

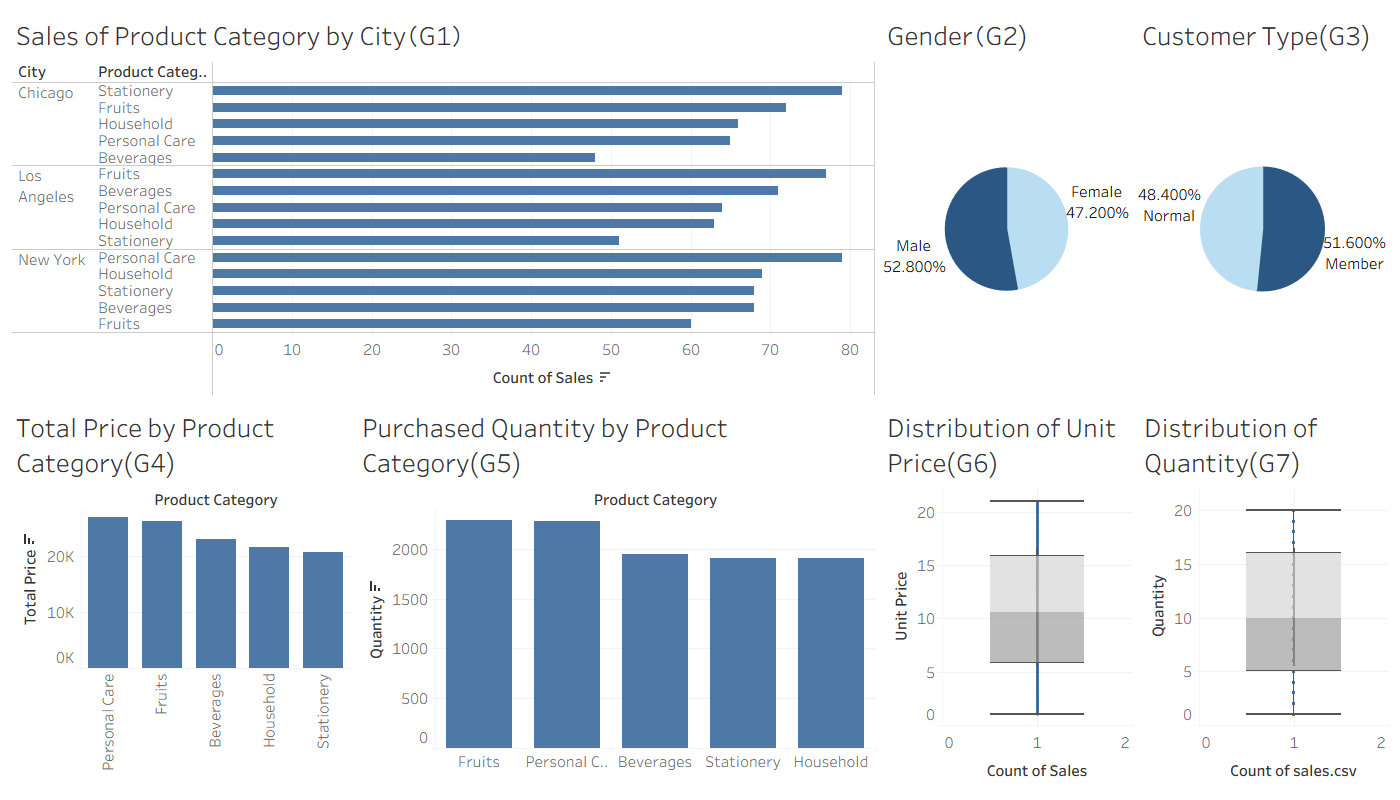
In this dataset, male customers represent 52.80% of the sample, while female customers account for 47.20%(See G2);  51.60% hold active memberships and 48.40% are non-member, reflecting an even distributional parity(G3).

●Product:

A total of five product categories were examined. When sorted from the highest to the lowest sales volume, the categories are personal care, fruits, beverages, household goods, and stationery, with respective total sales values of $27,050, $26,197, $22,935, $21,616 and $20,737.(G4)
Ranked in descending order of purchase volume, the product categories are fruits, personal care, beverages, stationery and household goods, with corresponding purchased quantities of 2286, 2278, 1952, 1913 and 1908, respectively.(G5)

For the unit price: min: $1.02; Q1: $5.87; median: $10.62; Q3: $15.88; max: $20.98.(G6)
For the quantity: min: 1; Q1: 5; median: 10; Q3: 16; max: 20.(G7)

●Regional Sales:

Chicago:

Stationery had the highest purchase volume, followed by fruits and household goods; beverages ranked lowest.(G1)

Los Angeles:

Fruits were the top-purchased category, followed by beverages and personal care, with stationery recording the minimum volume.(G1)

New York:

Personal-care purchases were highest. Household goods, stationery and beverages showed comparable volumes, while fruits were least purchased.(G1)

●Other Aspects

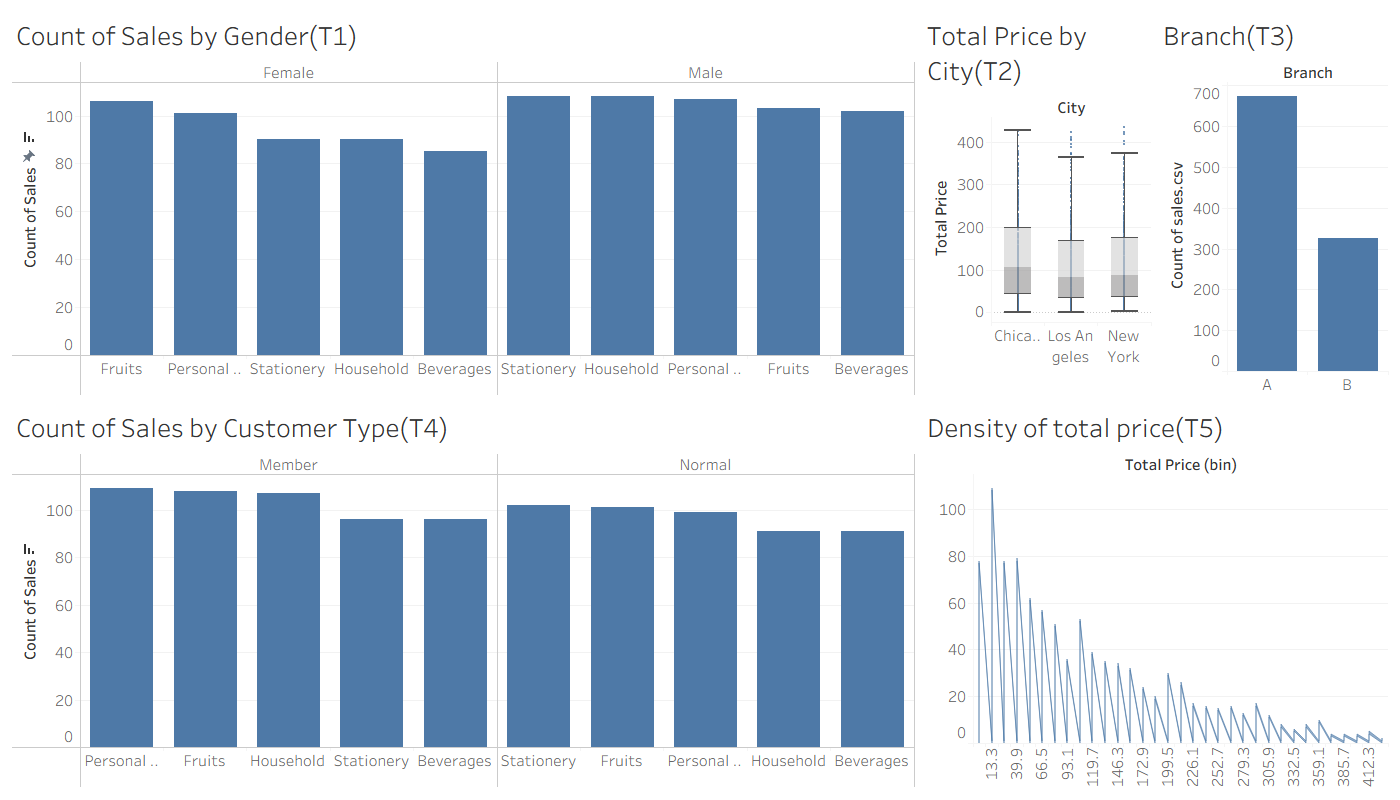
For female customers, fruits and personal care are the two most purchased categories, whereas stationery and household goods rank highest among male customers; Beverages represent the lowest-volume category for both genders.(T1) Member customers tend to purchase personal care and household goods, while non-members prefer stationery and fruits. For both membership groups, beverages exhibit the minimum purchase volume.(T3)
Customers in Chicago exhibit the strongest overall purchasing power, followed by New York and Los Angeles. However, some New York customers recorded higher transaction values than those in Chicago.(T2)

Branch A (672) is approximately double the size of Branch B (326).(T4)
Most total-sales values cluster at the lower end of the 13.3-to-93.1 range, with observation frequencies steadily decreasing at higher total-price levels. (T5)

Discribtive Ordinal Logistic Regression Models

●Ordinal Logistic Regression

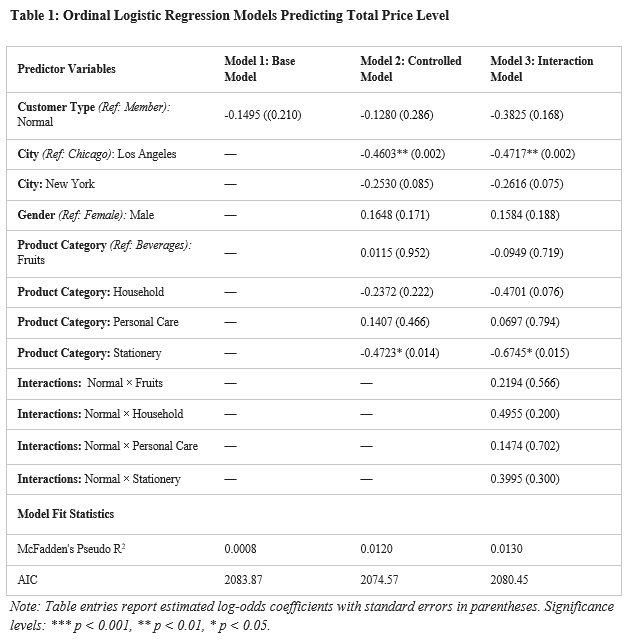
Model 1: P value of key explanatory variable is 0.21, exceeds the conventional significance threshold (ą = 0.05), customer membership status demonstrates no statistically significant relationship with transaction price levels.

Model 2: After introducing control variables including city, gender and product category, Los Angeles and stationery display significant associations with the outcome variable, with p-values of 0.002 and 0.014 respectively. Their log-odds coefficients are -0.4603 and -0.4723. Compared with Chicago, customers in Los Angeles are less likely to fall into higher total-price groups. Similarly, stationery purchases are less likely to result in higher-value transaction tiers relative to beverages.

Model 3:To further assess if membership moderates the relationship between the product category and total price level, interaction terms between customer type and product categories were introduced. Los Angeles and stationery remain statistically significant predictors. The corresponding log-odds coefficients are -0.4717 and -0.6745. All interaction terms return p-values above 0.05, indicating membership status does not moderate the relationship between product category and total price level. Gender shows no significant correlation with total price level across model specifications.

To prevent structural data leakage, deterministic accounting components (unit_price, quantity, tax, and reward_points) were intentionally excluded, ensuring legitimate econometric identification.
Across all specifications, McFadden's Pseudo R² remains modest (0.08% in Model 1, 1.20% in Model 2, and 1.30% in Model 3). Model 2 achieves the lowest Akaike Information Criterion (AIC = 2074.57), identifying it as the best-fitting models among three.

Lasso Regression Figure

●Lasso Regression

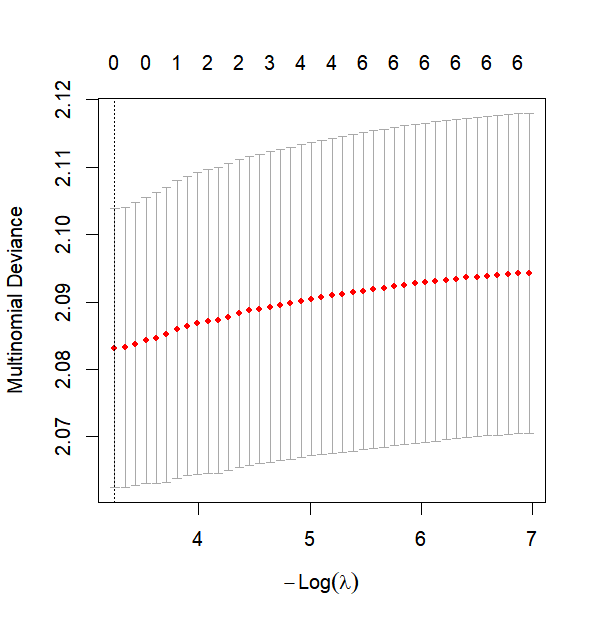
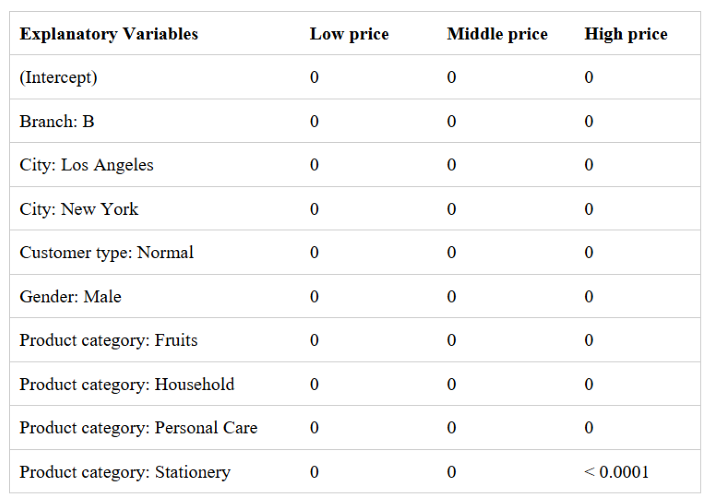
To enhance the robustness of the model, the machine learning model lasso regression was introduced.The results indicate that the multinomial Lasso regression shrinks nearly all predictor coefficients down to zero. Only stationery shows a tiny non-zero coefficient for the high-price tier. The left plot displays model deviance against the penalty parameter (ʎ).
As penalisation increases, most variables are eliminated from the model. Lasso suggests most selected variables have little predictive power for price tiers; only stationery has a very weak association with high-price transactions. The results demonstrate that these variables have no statistically significant association with the total price level. This is consistent with the commercial logic that total transaction value is primarily an arithmetic function of unit price and quantity.

Consequently, customer membership status provides no robust predictive utility for transaction price tiers.

Suggestion:

1. Conduct market research to identify factors explaining why stationery products fail to lift total transaction values.

2. Since membership status fails to predict transaction-spending tiers, member segmentation should instead rely on alternative dimensions such as spending frequency. Differentiated membership benefits and incentive schemes should be implemented according to product price tiers (low, medium, and high). Specifically: prioritise repeat-purchase incentives for members who purchase frequently but spend little per transaction, and deliver exclusive relationship-based management for members with low purchase frequency but high total spending.

Uniform discount campaigns should be avoided.

Last but not least,

I'm not chasing "the best", I'm chasing "better than yesterday".

Every dataset I touch teaches me something new,
and every project makes my analysis sharper.

What I bring to you

Integrity

KPIs matter, but value runs deeper. I measure what truly impacts the business. Metrics & KPIs measuring what matters, I measure what cannot be counted.

Accountability

Always responsible for the business's data, I uphold privacy as my obligation. Trust is built on security, transparency, and uncompromised ethics.

Rigor

One flawed number, ten steps backwards. Errors erode every data-driven decision. Accuracy is priority.

Build Your Data Solution,
Empower Your Business.

Let's start now